PA Program
Entering Class Profiles
Penn State College of Medicine Physician Assistant Program students come from diverse educational, cultural, and ethnic backgrounds.
Class of 2027 Profile
3,293
Applications
97
Interviewed
30
Matriculated Students
77%
Women
57%
Total underrepresented
13%
Underrepresented in medicine

More Facts About the Class of 2027
Over 4,600 hours of healthcare experience
3.85 average undergraduate cumulative GPA
309 average GRE score
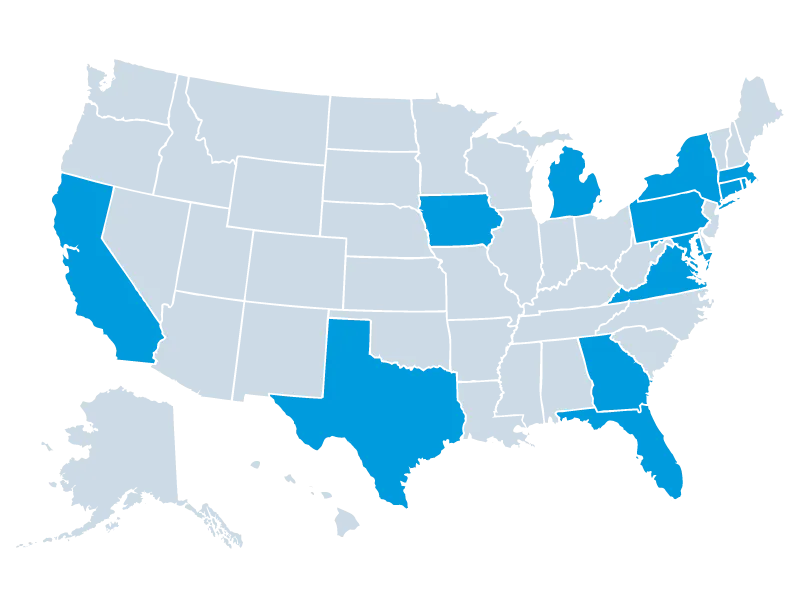
18 different states
13 students from Pennsylvania
Class of 2027 Facts and Figures
Applications and Interviews
Applications received: 3,293
Class size: 30
Students from Early Assurance partnership program: 0
Applicants interviewed: 97 (2.9%)
Applicants offered admission: 55
Demographic Profile
Women: 23 (77%)
Men: 7 (23%)
Underrepresented: 57% (Total underrepresented includes students who identify as underrepresented minority in medicine, veteran status, first generation in college, educationally disadvantaged, economically disadvantaged)
Underrepresented in medicine: 13%
Average age: 24.8
Pennsylvania residents: 13
Non-Pennsylvania residents: 17 (States represented: Connecticut, Florida, Texas, Rhode Island, Virginia, New York, Michigan, Georgia, California, Iowa, Maryland, Massachusetts)
Academic Profile
Overall cumulative GPA: 3.85 (range 3.58 to 4.0)
Overall science GPA: 3.8 (range 3.4 to 4.0)
Average healthcare hours: 4,670 (range 900 to 26,000)
Average GRE total: 309 average; (range 293 to 327)
MCAT average: 507
Class of 2026 Facts and Figures
Applications and Interviews
Applications received: 4,611
Class size: 30
Students from Early Assurance partnership program: 0
Applicants interviewed: 110 (2.4%)
Applicants offered admission: 47
Demographic Profile
Women: 19
Men: 11
Underrepresented: 83% (Total underrepresented includes students who identify as underrepresented minority in medicine, veteran status, first generation in college, educationally disadvantaged, economically disadvantaged)
Underrepresented in medicine: 7%
Average age: 25
Pennsylvania residents: 16
Non-Pennsylvania residents: 14 (States represented: Massachusetts, Utah, Minnesota, Vermont, California, Michigan, Virginia, Florida, Illinois, New York, Oklahoma, Georgia)
Academic Profile
Overall cumulative GPA: 3.82 (range 3.52 to 4.0)
Overall science GPA: 3.78 (range 3.32 to 4.0)
Average healthcare hours: 2,868 (range 400 to 27,472)
Average GRE total: 314 average; (range 302 to 328)
MCAT average: 512
See for GRE waiver eligibility.
Class of 2025 Facts and Figures
Applications and Interviews
Applications received: 4,932
Class size: 30
Students from Early Assurance partnership program: 0
Applicants interviewed: 100 (2%)
Applicants offered admission: 41
Demographic Profile
Women: 17
Men: 13
Underrepresented: 57% (Total underrepresented includes students who identify as underrepresented minority in medicine, veteran status, first generation in college, educationally disadvantaged, economically disadvantaged and/or from medically underserved areas)
Underrepresented minority in medicine: 20%
First Generation in college or educationally disadvantaged: 47%
Veteran: 10%
Average age: 25
Pennsylvania residents: 11
Non-Pennsylvania residents: 19 (Countries represented: Canada and the United States. States represented: Alabama, California, Connecticut, Colorado, Idaho, Illinois, Maryland, Michigan, Minnesota, New Jersey, New York, Ohio, Oklahoma, Virginia, Washington D.C., Wisconsin)
Academic Profile
Overall cumulative GPA: 3.72 (range 3.27 to 4.0)
Overall science GPA: 3.63 (range 3.03 to 4.0)
Average healthcare hours: 3,680 (range 500 to 23,455)
Average GRE total: 313 average; (range 301 to 326)
GRE quantitative: 157 average; 61st percentile rank (range 150 to 163)
GRE verbal: 156 average; 68th percentile (range 146 to 165)
GRE writing: 4.4 average; 70th percentile (range 2.5 to 6.0)
MCAT average: 516
See for GRE waiver eligibility.
2024 Facts and Figures
Applications and Interviews
Applications received: 4,620
Class size: 30
Students from Early Assurance partnership program: 0
Applicants interviewed: 86 (1.9%)
Applicants offered admission: 38
Demographic Profile
Women: 19
Men: 11
Underrepresented: 57% (this includes students who identify as underrepresented in medicine, veteran status, first generation in college, educationally disadvantaged, economically disadvantaged)
Average age: 25
Pennsylvania residents: 12
Non-Pennsylvania residents: 18 (States represented: California, Florida, Idaho, Illinois, Maryland, Michigan, Nebraska, New Hampshire, New Jersey, New York, Tennessee, Utah, Virginia, Washington)
Academic Profile
Overall cumulative GPA: 3.64 (range 3.0 to 4.0)
Overall science GPA: 3.64 (range 3.14 to 4.0)
Average healthcare hours: 3,040 (range 620 to 10,820)
Average GRE total: 315 average; (range 300 to 333)
GRE quantitative: 157 average; 61st percentile rank (range 150 to 168)
GRE verbal: 158 average; 77th percentile (range 149 to 169)
GRE writing: 4.3 average; 68th percentile (range 3.0 to 5.5)
MCAT average: N/A
See for GRE waiver eligibility.