
MD Program
Class Profiles
Penn State College of Medicine students come from diverse educational, cultural, and ethnic backgrounds.
See below for profiles of recent entering classes.
Class of 2025 Profile
11,207
Applications
617
Students Interviewed
150
New MD Students
51%
Of New MD Students Are Women
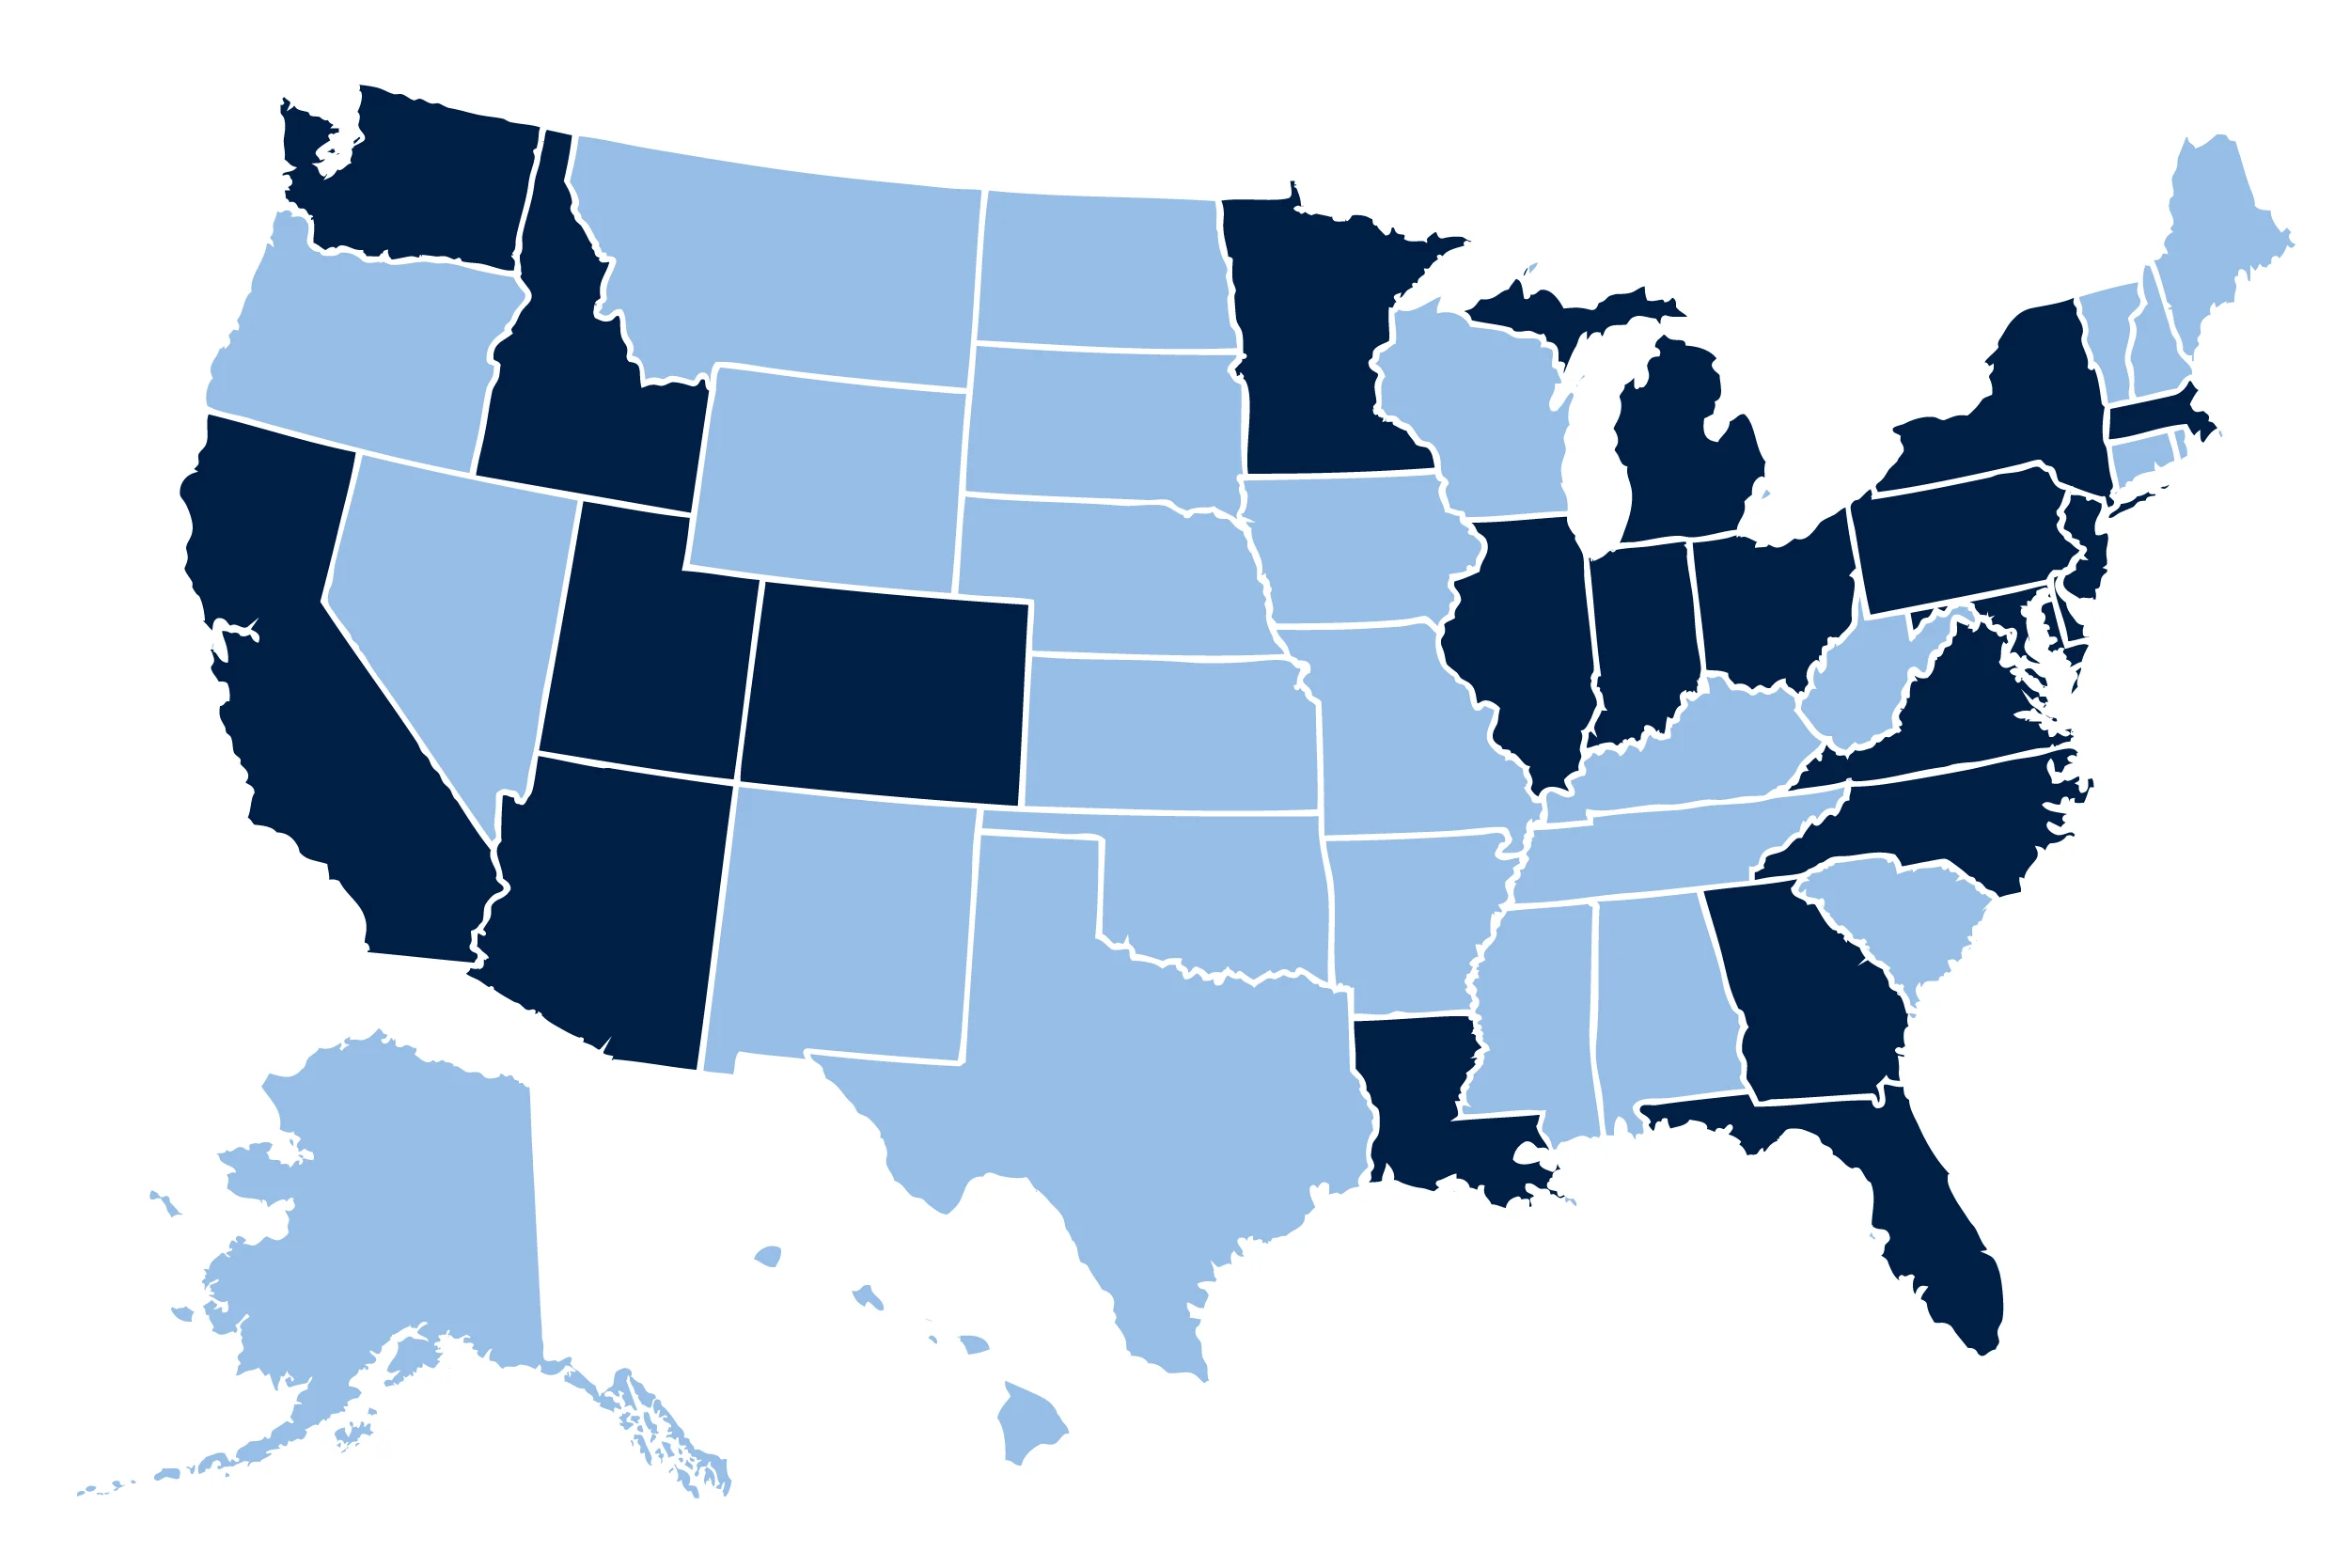
22
Different States Represented
45%
Pennsylvania Residents
Additional Facts About the Class
Academic Profile:
91 colleges and universities
43 single majors
23 multiple majors
Entering Class:
5 joining MD/PhD program
68 Pennsylvania residents
82 non-Pennsylvania residents
3 with a military background
International experiences in 58 countries
34 foreign languages spoken
Volunteers of more than 210 different service organizations
Albanian
American Sign Language
Arabic
Armenian
Bangla
Bulgarian
Chinese
Czech, Slovak
Dutch
French
German
Gujarati
Haitian Creole
Hebrew
Hindi
Korean
Krio
Kurdish
Latin
Malayalam
Mandarin Chinese
Marathi
Portuguese
Punjabi
Saurashtra
Spanish
Tajik
Tamil
Telugu
Twi
Urdu
Afghanistan
Antigua
Argentina
Armenia
Australia
Bahamas
Barbuda
Belgium
Belize
Brazil
Bulgaria
China
Cuba
Cyprus
Czech Republic
Dominic Republic
Ecuador
El-Salvador
England
France
Germany
Ghana
Greece
Guatemala
Haiti
Honduras
Hungary
India
Indonesia
Israel
Italy
Japan
Jordan
Kenya
Kyrgyzstan
Mexico
New Zealand
Nicaragua
Nigeria
Panama
Peru
Russia
Rwanda
Seville
South Korea
Spain
Taiwan
Uganda
United Kingdom
1 Academic Associate in Clinical Research
1 ACLS Instructor
1 Addiction Clinic Volunteer
1 American Red Cross Disaster Health Services Team Member
1 Blood Bank Volunteer
1 BLS Instructor
1 Camp Health Assistant
1 Camp Medical Counselor
1 Caretaker at Alzheimer's Center
1 Centre Volunteers in Medicine Volunteer
1 Certified Immunizer
1 Certified Patient Interpreter
1 Certified Pharmacy Technician
1 Certified Phlebotomy Technician
1 Clinic Volunteer
1 Clinical Aide
1 Clinical Appointment Coordinator
1 Clinical Care Technician
1 Clinical Case Management
1 Clinical Health Coach
5 Clinical Research Assistant/Associates
6 Clinical Research Coordinators
1 Clinical Researcher
1 Clinical Trial Team Member (NIH)
6 CNAs
1 Community Health Coach
1 Community Health Worker
1 COVID Case Investigator and Contact Tracing
2 COVID screeners
1 COVID-19 Testing Volunteer
1 COVID-19 Vaccine Clinics Volunteer
1 COVID-19 Vaccination Scheduler
1 Crisis Counselor
8 Emergency Department volunteers
24 Emergency Medical Technicians
2 Emergency Room Technicians
1 Family Caregiver
1 Firefighter
2 Free clinic volunteers
1 Green Beret Special Forces Senior Medical Sergeant
1 Head of Medical Records
1 Health Coach
2 Health Educators
Health Screening Research Associate
1 High School Sports Medicine Volunteer
1 Home Health Aid
6 Hospice Volunteers
1 Hospital Extern
24 Hospital Volunteers
1 Hospitality Associate
1 Human Research Technologist
1 Lifeguard
1 Measey Surgical Scholar
34 Medical Assistants
1 Medical Biller
1 Medical Center Volunteer
1 Medical Center Wellness Program Coordinator
2 Medical Interpreters
1 Medical Service Corps Officer
2 Medication Technicians
1 Mental Health Technician
1 Mental Rehabilitation Hospital Volunteer
1 Multi-skilled Technician
1 NICU cuddler
1 No One/Veteran Dies Alone Volunteer
2 Nurse Aides
1 Nursing assistant
1 Nursing Home Volunteer
Ophthalmic Technicians
Optometry Technician
Orthopaedic Surgery Research Fellow
2 Paramedics
1 Patient Advocate
1 Patient Ambassador
2 Patient Care Assistants
1 Patient Care Intern
4 Patient Care Technicians
1 Patient Care Transport Volunteer
1 Patient Experience Volunteer
1 Patient Screener
1 Patient Transporter
1 Pediatric Patient Care Technician
1 Pediatric Rehab Aide
PEP Program Volunteer
1 Personal Care Assistant
2 Pharmacy Technicians
2 Phlebotomists
1 Physical Therapy Center Volunteer
1 PICU Child Life Volunteer
1 PT Technician
1 Public Mental Health Therapist
1 Radiology Office Intern
1 Radiology Reading Room Associate
2 Red Cross Volunteers
1 Refugee Health Clinic Volunteer
1 Remote Area Medical (RAM) volunteer
1 Rheumatology Research Assistant
1 Safety Aide
1 Safety Sitter
36 Scribes
1 Scrub Tech
1 Simulation Technology & Education Center volunteer
1 Social Justice Intern
1 Special Operations Advance Tactical Paramedic
1 Sterile Processing Technician
1 Sterilization Tech
1 Surgical Office Intern
1 Surgical Scrub
1 Wilderness First Aide Provider
2024 Facts and Figures
Applications
Total: 9,382
Interviews
Students interviewed: 700
New students matriculated: 149
Academic Profile
Colleges and universities: 87
Single majors: 52
Multiple majors: 13
Entering Class
Total: 149
MD/PhD Program: 9
Pennsylvania residents: 36% (53 students)
Non-Pennsylvania residents: 64% (96 students from 21 states and one territory)
Women: 65% (93 students)
Military background: 2 students
International experiences: 58 countries
Foreign languages spoken: 25
Volunteering: More than 210 different national and local service organizations
2023 Facts and Figures
Applications
Total: 8,018
Interviews
Students interviewed: 746
New students matriculated: 145
Academic Profile
Colleges and universities: 89
Single majors: 41
Multiple majors: 27
Entering Class
Total: 145
Hershey Curriculum: 133
University Park Program: 12
MD/PhD Program: 9
Pennsylvania residents: 31% (45 students)
Non-Pennsylvania residents: 69% (100 students from 28 states)
Women: 65% (94 students)
Military background: 5 students
International experiences: 86 countries
Foreign languages spoken: 33
Volunteering: More than 100 different national and local service organizations
2022 Facts and Figures
Applications
Total: 8,293
Interviews
Students interviewed: 752
New students matriculated: 151
Academic Profile
Colleges and universities: 95
Single majors: 54
Multiple majors: 25
Graduate degrees: 15
Entering Class
Total: 151
Hershey Curriculum: 138
University Park Program: 13
MD/PhD Program: 3
Pennsylvania residents: 44% (66 students)
Non-Pennsylvania residents: 56% (85 students from 24 states and Canada)
Women: 61% (92 students)
Underrepresented in medicine: 11% (16 students)
Military background: 5 students
International experiences: 49 countries
Foreign languages spoken: 30
Volunteering: More than 125 different national and local service organizations
2021 Facts and Figures
Applications
Total: 8,815
Interviews
Students interviewed: 819
New students matriculated: 152
Academic Profile
Colleges and universities: 77
Single majors: 38
Multiple majors: 25
Graduate degrees: 16
Entering Class
Total: 152
Hershey Curriculum: 140
University Park Program: 12
MD/PhD Program: 8
Pennsylvania residents: 53% (80 students)
Non-Pennsylvania residents: 47% (72 students from 18 states)
Women: 63% (96 students)Proud to welcome students who Identify with Female, Male, and Nonbinary genders
Underrepresented in medicine: 12% (18 students)
International experiences: 48 countries
Participated in varsity athletics: 23
Volunteering: More than 125 different national and local service organizations